
Gantt chart for construction
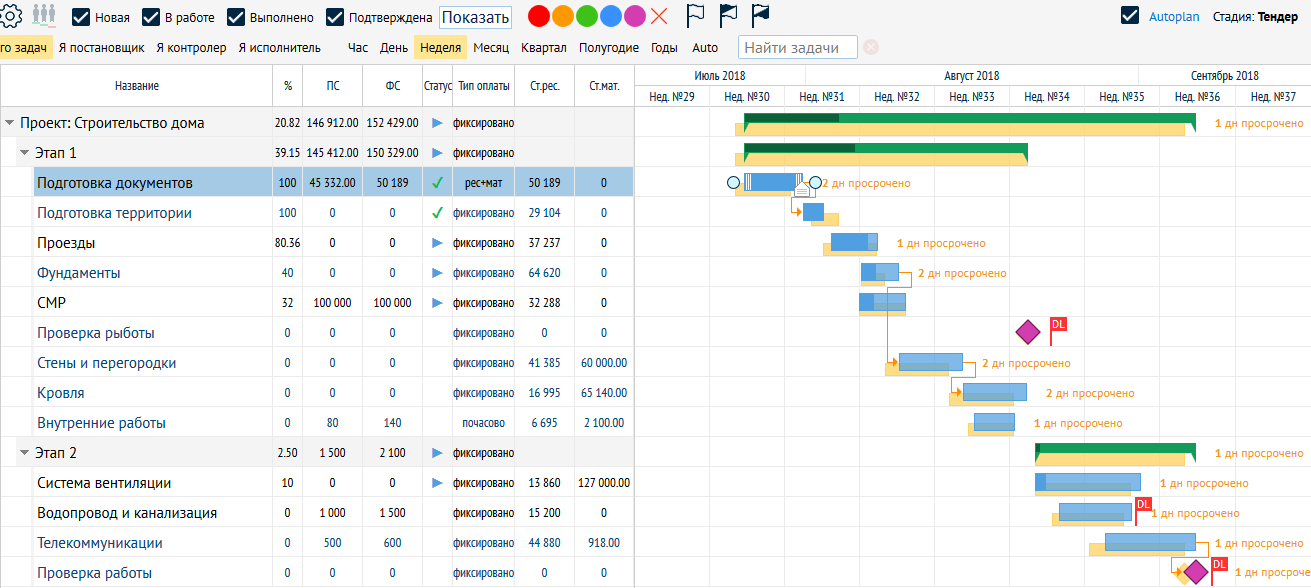
Thousands of companies use Gantt charts to increase productivity, improve communication, long-term forecasting and tracking results.
Gantt charts were created to visualize the start and completion schedule of specific project tasks. Using a visual display of milestones and other key dates, these charts offer a visual and memorable way to track tasks based on a scalable timeline and work results, regardless of whether they are tracked daily, weekly, monthly or annually.
When using Gantt charts, key employees have access to relevant information, and the visual component leaves fewer chances for misunderstanding, which is especially important when it comes to very complex tasks. Using online chartsallows all interested parties to the project to have access to the same information from different places, communicate and see changes in real time, which greatly simplifies the work on the project and saves time.
Charts provide an understanding of how the various tasks are interconnected and which tasks rely on completing the previous ones to achieve specific goals. These relationship relationships are built around an understanding of the timing of each task, which subsequently affects other tasks and provides the most optimal work progress, maximum productivity and overall project success. With the ability to predict, users can clearly distinguish which resources need to be attracted or allocated in order to maximize their potential. The more carefully the schedule is respected, the greater the likelihood that the costs of the project will be within the budget, and the project will be completed on time.
Despite the fact that using Gantt charts is quite easy to track and control everyday tasks, the advantage of Gantt charts is that they help the project manager or organization to see the big picture of all projects and control that each project works to achieve the long-term strategic goals of the organization.
